Thursday, March 10, 2016

Exceptionally deep Mexican mid level low!

Been forever since I've had a chance to post... this was extracted directly from my e-mail to colleagues 24 hours ago at 5AM Wednesday.

"What a whopper of a system digging through Mexico overnight tonight...  This area is notoriously datasparse with respect to upper air, however.  As the system rocketed just south of due sewd AOA 40kts from 18Z/07 to beyond 12Z/08 given the formidable high level jet energy on the back side of the large scale trough... a 545 dm 5H height was observed at San Diego 00Z/08 at about the time the shear axis had wholly evolved into a closed circulation which later passed E of the site; while the following morning Tuscon observed a 548 dm 5H height 12Z/08 in the nern semi-circle of the mid level low.  Neither of these obs actually cracked 2.5 standard deviations below normalized climo--while in itself respectable--given their latitude this time of late winter.  The 00Z/09 EC, NAM, RAP, and GFS initialized quite closely in showing the 549-550 dm 5H closed low centered over the srn coast of Sonora... with the former two models a tad deeper and more in line with UA obs (on the edge of the nrn semicircle of the system, of course).  On that note, this is not a model verification review or deterministic model discussion... but trends in the EC/GFS look quite similar during the next 36 hrs though again the former remains stronger, and farther west during the system's digging phase. 

Local Time, between roughly Tuesday afternoon and Thursday afternoon--i.e., 21Z/08 through 21Z/10--the anomalous nature of this mid level low... a whopping 6 to 10 standard deviations below normalized climo... will max out as the motion of the cyclone curves from sewd to nnewd during the final ~18 hours of that period.  First... I attached the 00Z/09 GFS ensemble mean forecast at 18Z/09--whose 00Z initialization FYI matched the operational GFS quite well re: depth/geometry of the 5H low/nearby trough.  The colored part of the image shows the large area of exceptional height anomalies on the 5H low's southern periphery (not an atypical location whatsoever)... this is about as large as the 6+ standard deviations below climo appeared to get, so I grabbed the earliest frame of that period which was 18Z or noon today LT.  I have only seen mid-level systems this anomalously deep twice operationally in the last 8 yrs (when I regularly began including climo in my forecast process).  Secondly... I also included a now-roughly-valid-time SFCOA (SPC mesoanalysis) "diagnostic" plot of the 5H heights/winds--at 09Z/3 AM LT--showing the location/depth of the low at the time of this writing.  Though not directly correlated with the anomalously deep mid-level low of course, significant aviation hazards (primarily in the form of severe turbulence) occurred on both sides of the northward-trailing mid through high level trough axis (not shockingly, primarily on the back side), underlining how assessing anomalies--aside from hastening UA analysis and setting the stage for the forecast funnel process/development of a conceptual model--quickly indicates the unseasonable degree of anything from a high precipitable water plume, to a surging cold air mass, to a powerful ~southerly LLJ, all with objectivity... the anomalies naturally having some correlation with significant weather hazards."

Additional info from tonight's shift: 5H low was still moving SSE between 00Z-06Z/10... but as of 09Z/10 has turned due E and is about to rapidly redevelop northeastward, likely as a separate/new circulation... while the fwd-side-of-trof gradient tightens in response, and the mid level jet now occupying the srn semi-circle of the central Mexico 5H low concurrently redevelops to the east side of the 5H low--in NNE-to-SSW fashion from GGG-BRO-Mexico City Mexico to the cstl wtrs of Guerrero by 18Z/10.  Am astounded at the 00Z NAM's fcst of a 70-80kt 750-1250 meter low latitude LLJ-let forecast E of the surface low to develop and lift northward through the wrn Gulf of Mex 06-12Z... the srn extent of which initially evolved in the tropics near 22.5°N!  Truly unusual for a powerful LLJ, even of somewhat small expanse.  Meanwhile, said surface cyclone has, in advance of the mid-level low's evolution (both longitudinally and temporally), redeveloped rapidly from the waters just northeast of Tampico Mexico to the waters ~100nm SE of BRO in only ~3 hours as of earlier this Thursday morning (around 06Z/10).

Finally, here's a link to a nice surface analysis valid at 00Z/10, including PMSL OA, via Tim Vasquez... showing said sfc low's position just northeast of Tampico Mexico:  http://imgur.com/YfvO1S6


Tuesday, June 10, 2014

06/05/14 damaging wake low in KC metro

Copied & pasted straight from an e-mail and the images I shared with my colleagues last weekend:

Below are a few images of a 16Z (11AM CDT) sfc analysis I created (in NMAP) of the remarkable surface observations during our damaging wake low event late Thursday AM.  This is the first one I can remember seeing operationally in a long while, and absolutely the first one I've witnessed "in person."  (I was in between mid shifts, and the loudness of the southeasterlies and the odd "occasional waves" that the wind arrived in locally at my house, was super-interesting).  Now, numerous times I have observed and hand analyzed MCS-induced rain cooled mesohighs that actually have pressure falls in their wake--and often even a co localized MSLP minimum in association with the falls--but this being in large part simply due to the bubble high having shifted eastward, IMO.  A true wake low event like on Thursday I have not witnessed anywhere near as often.

I used linear interpolation of the sfc obs to create the isobars in east KS and western MO, given the extreme pressure gradient that existed.  No surprise, in two cases I had to "throw out" the 1004-mb-isobar interpolation that arose from two pair of interpolated obs (1: IDX-MKC and IDX-MCI, and 2: OJC-SGF and IDX-SZL); each pair created an excessively wiggly/pointy portion of the isobar when playing "connect the dots" after the interpolation was complete... which again didn't shock me given the localized dense observations among which I was interpolating--amidst an extreme pressure gradient.  I used the mean of each pair of 2 obs to create a single interpolation point for each pair, in effect smoothing them out... and I'm quite satisfied with the result.  Diagnostically, SFCOA/SPC's Mesoanalysis, as well as MSAS, no surprise could not "catch up" with the evolution of this event, let alone even begin to represent a sub-mesoscale/wake low if it tried (comparatively broad bubble highs, MSAS usually does pretty nicely with; as for the wake low, the mesoanalysis as well as MSAS each only fell to ~1006 mb, basically showing a weak inverted trof stemming NNEward from ncntrl OK).  As for the rest of the region outside of east KS and western MO, I just eyeballed the sfc obs to create the isobars, as with a typical hand analysis.  Finally, FWIW, on a typical hand analysis I probably wouldn't have drawn the "squall line" symbol (red line with occasional red dots; I instead use it more as a means of delineating a "leading edge gust front")--quite as far north as I had, particularly given 1) the increasing distance into the cool sector (where I rarely analyze gust fronts/outflow boundaries--and, in fact, there was no well-defined leading edge gust front whatsoever via sfc obs), and 2) the comma head was becoming largely stratiform in nature.  However, I did so essentially to identify the rough N-S location of the entire MCS structure on the surface analysis, given that there was no overlaid radar data.


Image 1 above (click to enlarge): regional, "zoomed-out" version.  You can see a couple 1005 mb synoptic sfc lows near Clinton OK and Tahoka TX, but the most important features along the KS-MO state line are hard to read or discern--as expected; the point partly was to exhibit the extremeness of the pressure gradient near the interface of the bubble high and meso low.


Image 2 above (click to enlarge): zoomed-in version.  You can far better see the sub-synoptic highs and lows, and the isobars, on this one.  Two 1002 mb meso (wake) lows exist near OJC and STJ respectively; and a pair of meso highs exist near Odessa MO and way down near SGF.  (The former meso high resulted from raincooled air beneath the MCS' comma head; and the latter meso high was associated with and immediately behind the severe bow echo that was raking swrn MO).  Also notice that the distance between the 1001.7 mb Olathe KS wake low and the 1015.3 Odessa MO bubble high is only 35 nm, with a pressure difference of 13.5+ mb between the two features!


Image 3 above (click to enlarge): I removed the surface obs so it wasn't so messy, and having  computed the 2-hour pressure changes I put the ones on the map that met or exceeded +/- 3 mb per 2 hr.  Note that 8-12 mb falls per 2 hours are common in the area in which the wake lows bottomed out.  Synoptically driven mid-latitude systems over the CONUS, in my experience, typically produce 3 hours pressure falls in the 9-11 mb range at the largest (pressure rises meanwhile can be a tad stronger yet, as you'd expect).  But this was a 2-hour fall I'd computed (equivalent to 12-18+ mb 3-hour falls... 3 hours being the time-window with which I'm used to gauging isallobaric adjustments/forcing); granted, again, this was sub-mesoscale/stormscale in nature, and thus kind a different kind of animal--I simply brought that up for comparison purposes.  FYI the reason I used 2 hour falls was simply because, based on the motion of the bubble high and the developing wake low, and the rate and time at which the wake low developed... 2-hour changes best showed the pressure rise/fall couplet, while 3-hour changes washed out its "significance" to some extent.

Finally, kudos to SPC, who put out the watch for KC metro at 8 AM (2 1/2 hours before the wind damage got going via the wake low, and 3 hours before it affected KC metro).  IIRC the discussion included mention of potential wind damage on the leading edge of the increasingly stratiform comma head, though that appeared unlikely even as morning wore onward; regardless, the watch did not extend very far downstream, so it is obvious they weren't excited about that particular threat or at best wanted to take a wait-and-see approach with it.  More importantly, they identified in the associated watch text the potential for wake low development with time--completely prior to it happening.  Based on the previous info and watch box structure... the main thrust w.r.t. feeling a watch was necessary must have been recognizing somewhat early on the potential for a wake low.  Pretty slick IMO.

Wednesday, April 10, 2013

04/08/13 damaging nighttime tornado in swrn NE with strong CIN

On 04/08/13, a cluster of small updrafts were ongoing N of Goodland KS around 01Z.  Between 0140Z and 0200Z, two updrafts exploded on the srn flank of this activity, turned to the right of the mean wind, and per LSRs issued in the next 18 hours apparently produced simultaneous damaging supercell tornadoes 3E Benkleman NE and 8SSE Max NE near 03Z.  Of primary importance, the storms were likely in an environment characterized by rather strong inhibition to surface-based parcels. **Edit: recent PNS from WFO GLD officially verified that the westernmost of the two supercells did produce a tornado.  It occurred at 0310Z, lasted one minute, and was rated EF-1.  The natural conclusion would be that the tractors flipped 8SSE of Max by the easternmost supercell were deemed to be caused only by non-tornadic winds.**

Monday afternoon, an energetic upper trough--with most of its jet energy on the back side--was digging through the wrn CONUS with 543-dm 5H closed low centered over swrn UT.  Associated sfc pressures were anomalously low from the 4 corners states swwd thru the lwr CO river valley; a 988 mb sfc low was centered near PUB, and sfc pressures as low as 991 mb reached the srn half of AZ (which is in excess of 5 standard deviations below climatological  norms for that area; i.e., very, very rare for early April).  Forcing for upward vertical motion likely ejected across the central High Plains by late afternoon in support of convective development.  A diffuse dryline would be the focus for initiation, with the segment from some distance NW of AKO (where in intersected a sagging cold front; see rough sfc analyses below) to 50SW GLD looking to have the highest probability of initiation based at least partly on background modulation on the synoptic scale.

A rather veered nocturnal LLJ acted to shallow the return-flow moist layer somewhat over the srn Plains by Monday morning, with boundary layers only 1 km deep at DFW/OUN capped by deep/seasonably warm EML layer immediately above.  Throughout the day a modest sely LLJ re-developed over KS/srn NE, as the primary LLJ TX-OK-MO gradually backed... contributing to moisture advection E of dvlpg/effective dryline.  By 00Z a 1250 m moist layer was observed at DDC (although this was co-located with the dryline); while 1500 meter depths were observed at LBF (just south of aforementioned cdfnt) and LMN; and a nice 1900 m moist layer depth was observed at TOP.

The 00Z LBF RAOB's T/Td profile looked gorgeous, with backed mid-level trajectories during the day having maintained cool capping aloft (e.g. 1 C at 7H) above the boundary layer, and 68/55 F at sfc contributing to ~2000 J/kg MLCAPE and ~0 J/kg MLCIN; and moreover, a profile that would support a weak CIN environment even with diurnal cooling of the near-surface layer.  However, the DDC RAOB showed 7 C at 7H, as did the DEN RAOB with its deeply mixed sfc-based layer.  Model initializations/mesoanalyses also indicated the tightest gradient in the capping aloft (e.g 3-6 C at 7H) was hugging the NE-KS border region late aftn-evening, with trajectories there resulting in WAA having developed in the capping layer.  In fact, mesoanalysis time series showed 5-6 C at 7H consistently in the near-storm environment of the small storm cluster that moved from 40ESE LIC to 20N MCK and ultimately produced the damaging nighttime tornado.

In Davies and Fischer 2009 (http://www.nwas.org/ej/2009-EJ3/), hereafter DF09, 1705 RUC soundings associated with non-tornadic, weak tornadic, and significantly tornadic supercells were examined from a thermodynamic and vertical shear standpoint to see which parameters might best discriminate among the categories both during the day and at night.  Ultimately, MLCIN proved to be the strongest discriminator among nighttime non-tornadic supercells and nighttime significant tornadic supercells... with almost no overlap in the middle 50% of each category, a strong overall difference from the MLCIN distribution within the daytime subset.  MLCIN of less than 50-75 J/kg was very common among nighttime weak and nighttime significant tornadoes.  In fact, 90% of the nighttime significant tornadoes occurred with less than 75 J/kg MLCIN.  (These overall findings are not surprising when viewed in the context of Davies' groundbreaking paper on CIN & LFC heights associated with tornadic and non-tornadic supercells: http://www.jondavies.net/waf796/waf796.htm).  0-1 km SRH also showed a pretty dramatic increase when moving from nighttime nontornadic supercells to nighttime significant tornadoes, especially compared to the daytime subset, but a lot of overlap occurred among the nighttime categories.

In a companion paper (Fischer and Davies 2009 at http://www.nwas.org/ej/2009-EJ4/), hereafter FD09, we looked carefully at two long-lived supercells in rather strong CIN environments which produced 2 and 4 nighttime sig tors respectively: the 5/29/08 Jewell and Belleville KS area tornadoes; and the 06/11/08 Salina, Champan, Manhattan, and Soldier KS area tornadoes.  Additionally... the 04/24/08 Beloit KS sig tor and 4/09/11 Storm Lake IA area sig tors had a lot of similar storm-scale and environmental characteristics to those storms in FD09.  All of these events involved well-established long-lived supercells which started out generally in rather strongly/deeply mixed environments, and toward darkfall progressed fully into the moist axis as the boundary layer diurnally cooled.  All 4 events' near storm environments possessed 1500-3000 J/kg MLCAPE, 80-140 J/kg MLCIN, 500-800 m2/s2 0-1 km SRH, 6.5-11.5 0-1 km EHI, and 60-80 kts 0-6 km bulk shear.  In all cases the CIN resulted primarily from diurnal cooling beneath a warm EML base (i.e., moisture was seasonably favorable and reasonably deep at sig tornado time).  Very largely-looped and long hodographs developing in the near-storm environment of the well-established supercells likely contributed to intense vertical pressure gradients such that the stable layer was able to be overcome to allow for production of significant tornadoes in spite of larger MLCIN than is typical of the majority of sig tor near storm environments.  While the 0-1 km SRH and 0-1 km EHI distributions in DF09 were each by far the largest in the nighttime sig tor category compared to the other 5 categories, the 0-1 km SRH and 0-1 km EHI within the two FD09 events/other two aforementioned events easily exceeded the 90th percentile of each for nighttime sig tors in DF09; i.e., off the charts, so to speak, and climatologically rather rare.

Given the type of set-up on Monday, a fairly quick transition from high-ish LCL/weak CIN environment to low LCL-strong CIN environment was expected--not strongly different from the environment evolutions in FD09 as described above.  Though backing a moist boundary layer up onto the High Plains is typically a big--and underappreciated--positive for retaining weak-CIN after dark environments in the Great Plains (given that elevation minimizes the impact of the EML)... the lack of richer/deeper moisture, and the lack of cool capping aloft in and upstream of the area, far overwhelmed the elevation impacts.  Sfc temps fell pretty quickly in the "moist sector" too, despite the strong low-level gradient...with 65-70 F by 23Z invof IML-MCK-CBK-GLD.

The 02Z RAP initialized sounding (see below) was favored over that at 03Z as the near-sfc T/Td/wind details were far more accurate on the 02Z sndg.  (Given I was away from work, I used Earl Barker internet data and thus soundings & hodographs are not modified).  With a 1 km deep moist layer with mean (ML) dew point of 56F, topped by a sharp (i.e., dry adiabatic nearly all the way down) EML base warm enough such that 7H temps were around 6 C... MLCIN of 145 J/kg was accumulated via the sounding.  The similarities of this sounding's shape with the two events' proximity soundings from FD09 are underlined by the fact that all three had a ML LFC between 2900 and 3000 meters.  The striking differences between this case and the FD09 cases, however, aside from the simple fact that this case's damaging tornado received only an EF-1 rating, are: 1) modest instability, with under 1000 J/kg MLCAPE; 2) a rather young storm, being less than 90 minutes old at the time of the tornado; and 3) somewhat weaker low-level shear, with 0-1 km SRH near 400 m2/s2 (the impact of a dramatically weaker observed motion vs. Bunkers overwhelmed the impact of a more rightward observed motion vs. Bunkers--result in this case being weaker-than-shown SRH, for what it's worth). The fact that the tornado was brief and the storm was not cyclic would tend to make sense.  The storm was also about to cross the sagging cold front, though with 1) slow storm motions and 2) (primarily non-NWS) sfc obs immediately N of the sfc front indicating (away from rain-cooled areas) quite similar sfc theta-e as just S... a further increase in CIN due to crossing the front may not have occurred particularly quickly.

Images:
-poorly analyzed 00Z and 03Z cntrl High Plains sfc analyses (obs via Al P.); red dots = rough positions of 01-02Z tornadoes on 00Z map... and of ~03Z EF-1 tornado E of Benkelman, damaging wind/false tornado report SSE of Max, and supposed "snownado" W of Akron on 03Z map
-low res radar evolution 02-03Z; recall westernmost supercell (which passed just nw outside of the tor warning polygon), whose appearance at least via base reflectivity was the less impressive of the two, was the one that produced the tornado
-02Z RAP 00-hr fcst sounding at McCook NE.  Note the lifted parcel path shown on the sndg is via a SB parcel, though a lowest 100 mb ML parcel would be more appropriate.  (Given the shallow drier near-sfc layer, and the lowest 100 mb temp profile being less than dry adiabatic... the potential temperature and the mixing ratio of the SB parcel are smaller than that of the ML parcel; and thus the SB parcel path rises to the left of--and accordingly has weaker CAPE and stronger CIN than--the ML parcel.)  Parameters from the sndg are as follows...

Unmodified model sfc T/Td: 62/55 F (thermodynamic parameters below are based on unmodified sndg)
Observed sfc T/Td: 63/55 F
SBCAPE: 803 J/kg
SBCIN: 178 J/kg

Unmodified model ML T/Td: 64/56 F
MLCAPE: 893 J/kg
MLCIN: 145 J/kg

0-3 km MLCAPE: 0 J/kg
MLLCL: 614 m
MLLFC: 2945 m

Bunkers storm motion: 209@ 27 kts (storm-relative parameters below are based on this motion and the unmodified model hodo)
Observed storm motion: 235@15 kts (0-1 km SRH "area" using this motion is swept out for visual purposes on the hodo)
0-1 km SRH: 436 m2/s2
0-3 km SRH: 557 m2/s2
0-6 km bulk shear: 57 kts
5 km sr wind: 18 kts
10 km sr wind: 41 kts
0-1 km MLEHI: 2.4


Tuesday, February 12, 2013

Hattiesburg MS EF-4 tornado environment

I had the day off Sun Feb 10 (and was watching a TWD marathon) and not paying a lot of attention to the weather until after darkfall, when I began to catch photos and video of a fairly large and certainly destructive tornado which had struck Hattiesburg, MS.

A quick review of data indicated a slow-moving upper level trough in place from ND-MT southwesteward to the lower CO river valley.  An occluding/stacked deep layer low would move from wrn NE to srn MN throughout the day.  Along/just ahead of the trailing cold front, a surface-based squall line had already initiated by midnight local time across nearly the entirely length of TX (SPS to DLF) along and just ahead of the trailing cold front... supported by ML dew points of 52-60F and high-level flow that would gradually become very difluent and divergent through the remainder of the day.  By dawn, rather rich moisture well downstream was in position to advect from the wrn Gulf of Mexico into the lower MS river valley... with ML dewpoints of 64-68F, and a moist layer depth of 1.5 to 2.5 km (with the remnant EML having already lifted nearly entirely for surface-based storms soon after).  The threat for severe storms would naturally be enhanced along and just south of the retreating warm front as storms within and ahead of the squall line swept into the destabilizing warm sector.  Some of the more destructive tornado outbreaks with several discrete tornadic storms do seem to be associated with a slow-moving large scale trough and a band of marked difluence/divergence ejecting out to the southeast over a deep moist layer... although in the end, convective mode did become a bit on the muddled side with lots of storms on Feb 10.

As early as 1 PM local time, pre-squall line storms were already plaguing northern portions of the LA "panhandle" and the adjacent southern 1/3 of MS.  The upswing in pre-squall line convection was further supported by a considerably strong corridor of increasing low-level moisture convergence/advection along the gradually veering 50-kt synoptic LLJ axis.  Accordingly, by 22-23Z a number of storms evolved into discrete supercells along and south of the effective warm front.  Interference among various supercells and individual seeding from upstream convection may have kept a more widespread/damaging tornadic event from occurring, but the supercell which tracked ENE through Hattiesburg was one storm which obviously thrived in a somewhat less messy local area on the southernmost flank of the training convection.  The fact no lives were lost is a wonder and a blessing, as this was a EF-4 rated tornado.

The LIX RAOB was launched about the same time the tornado initiated and 60 nm to its south--free of convection.  Although the Hattiesburg area was affected by convection for much of the~5 hours prior to the tornado... during nearly an hour preceding the arrival of the tornado, the inflow environment "cleared out" aside from some possible "sprinkles" from the storm's own anvil business given 8-10 km flow averaging 280 degrees.  However, the surface layer via the ob had remained relatively mild (near 70F) all afternoon considering the preceding thunderstorms... and didn't really climb all that much during the period of pristine inflow--so a moot point, perhaps, esp given the rather rich/deep moist layer. 

Anyway, I modified the lowest ~35 mb of the LIX RAOB very slightly based on obs from KHBG; e.g., the surface temp was reduced ~1F and the surface dew point ~1.5F.  The RAOB surface wind, 21006, was perhaps a bit too light/veered--with 18510 being more appropriate based on the "clear inflow" period as well as obs closest to the general south--but I didn't adjust the hodograph and present it in a different form because the hodograph shape and vertical shear parameters would have changed very, very little.  A final note on the shear environment... the near-surface hodo (wholly around 180-190 degrees in the surface to kink layer, if "modified") was relatively backed considering 900 m AGL flow having veered all the way to 225 degrees (from due SW).  Also, the kink height was quite low for a U.S. significantly tornadic supercell occuring near or east of the MS river: 113 m AGL.  Then again, the most well-defined kinks are not characterized by as much windspeed increase above the kink as this one, so this is not a particularly classic case of a sharp low level hodograph kink (which are most common west of the MS river).  Below are the surface-based and lowest 100 mb mixed-layer thermodynamic parameters from the modified LIX RAOB as well as the vertical shear parameters from its unmodified hodograph (both of whose images appear below).

Sfc T/Td: 71/66.5°F
SBCAPE: 567 J/kg
SBCIN: 73 J/kg

ML T/Td: 75/67°F
MLCAPE: 1083 J/kg
MLCIN: 8 J/kg

0-3 km MLCAPE: 91 J/kg
MLLCL: 566 m
MLLFC: 1419 m

0-1 km SRH: 305 m2/s2
0-3 km SRH: 360 m2/s2
0-6 km bulk shear: 67 kt
storm motion: 245° @ 40 kt


Wednesday, January 30, 2013

Observed environment of killer tornado in Adairsville GA

On January 30, a discrete cell moved northeastward from central AL to nwrn GA... by which time a long-lived QLCS began to "absorb it" from behind.  Storm motion was 50-55 kt during this period as it gradually curved from direction ~210° to ~225°.  Just about the time it was becoming absorbed by the QLCS (~1615Z) the cell spawned a rather substantial-looking tornado in and around the city of Adairsville GA.  This tornado killed at least one person and overturned numerous vehicles per the LSR.  WFO Peachtree City, 55nm to the SSE of the tornadic storm, launched a special RAOB about 45 minutes later...giving us a somewhat rare look at the observed environment of a tornado.  A link to a short video clip of the tornado is here: http://twitter.yfrog.com/jojvyvkslexkozpdbjxdfoxcz


I modified the RAOB very slightly via cooling the near-surface layer a bit to be perhaps more representative of the inflow; while the surface wind on the RAOB looked sufficiently representative.  Am not getting terribly cute regardless given some showers existed in the inflow environment.

Here are some of the parameters from the modified RAOB.  Should note first, the often typical "weaker SRH" (due usually to a more veered sfc-kink shear vector and/or a weaker LLJ) NAM solution actually was more correct by comparison than the RAP solution was.  Usually the RAP is the winner in this department.  Also, the 2-6 km anticyclonic kink/subtle veer-back-veer pattern with height--and associated SR-flow weakness--fcst by both the NAM and the RAP...which I've found present in a good handful of observed tornadic supercell environments...was not present whatsoever via the RAOB.  i.e., the cell likely had favorable SR flow at all levels.  The angle between the surface to kink shear vector and the storm motion is less than 60 degrees... not atypical of many tornadoes in the ern United States--in fact the hodograph itself is quite reminiscent of some past sig tor events' observed hodographs in MS/AL/TN.  And finally, the RAOB hodograph's "Bunkers right mover" fcst motion for this cell during its tornadic phase nailed the observed motion, with the direction essentially spot on and the speed very close or a touch faster than observed (not surprising given the somewhat shallow convective layer?).  The storm was certainly an EL-buster based on the echo tops/visible satellite presentation.

Sfc T/Td: 68/64°F
SBCAPE: 440 J/kg
SBCIN: 12 J/kg

ML T/Td: 71/63°F
MLCAPE: 428 J/kg
MLCIN: 1 J/kg

0-3 km MLCAPE: 139 J/kg
MLLCL: 566 m
MLLFC: 669 m

0-1 km SRH: 344 m2/s2
0-3 km SRH: 495 m2/s2
0-6 km bulk shear: 75 kt
storm motion: 228° @ 53 kt


Sunday, September 9, 2012

estimate of 09/08/12 NYC tornado environment

Images at bottom of post:
18Z OKX RAOB overlaid on 12Z OKX RAOB
12Z OKX hodograph (with NYC tornadic supercell motion estimate)
18Z OKX hodograph (with NYC tornadic supercell motion estimate)
15Z high-res RAP initialized sounding at JFK with very slight near-sfc modifications as needed (26/23C at the surface; near-surface temp and to a lesser degree dew point were a bit underdone)
15Z high-res RAP initialized hodograph at JFK (with NYC tornadic supercell motion estimate)

No time to dissect this event closely, but it appears as though the mid-morning roughly N-S band of storms containing the tornadic supercell initiated in an area of weak mid-level height falls well downstream of the mid- through upper-level neutral tilt large scale trough.  At the time the trough was positioned over ern Ontario, Lake Huron, and lower Michigan... with the forward-side-of-trough mid- to upper-level jet axes overspreading (at best) the OH river valley and ern Great Lakes/wrn NY/swrn Que.  Best (only?) correlation I can find re: an initiating mechanism, synoptic/mesoscale/sub-mesoscale, would be rather strong moisture advection occurring across a sharp low level dew point gradient.  This moisture appeared to move up the border region of ern NY and CT-MA-VT with time...nearly coincident with the initiation of the batch of surface-based storms.  Sfc dews on Long Island certainly jumped 4F or so between 11 and 14Z.  Beyond that haven't and probly won't assess it much more from a convective initiation and maintenance standpoint.

Interestingly, the 15Z RAP sounding looks literally like an exact interpolation of the 12Z and 18Z OKX RAOBs (only with the exception of the 500 m to 3 km layer dew point; that layer is of course saturated), so confidence in this sounding's shape and character in representing the environment is quite high.  Any semblance of steep mid-level lapse rates or remnant EML is lacking, yet very rich low-level moisture (lowest 100 mb ML dew points of 71F) and the 3 km deep moist layer helped contribute to moderate MLCAPE (~1500 J/kg) and no MLCIN.  Also... very strong low level MLCAPE (~180 J/kg from 0-3 km AGL); and the typical "LCL = LFC" tornado-friendly environment with both being very low at ~490 m.

The shape of the near-surface hodo and associated low level SRH magnitude is anyone's guess.  Surface flow in the mesoscale env was likely around 160 degrees across the board; but all the soundings shown here (the two RAOBs as well as the RAP sounding), strangely enough *especially* from the RAOBs, have surface flow that is unrealistically veered (from 180 deg or more).  The strength of the sfc flow looks reasonable on the RAP sounding, while on the 18Z RAOB it is surprisingly light when compared to wrn-cntrl Long Island ASOSs.  Unfortunately VWP data from the local 88D was very sparse during the event, which means making a high-res VWP hodograph to represent this tornadic supercell is impossible.

Final note... the srn-cntrl Quebec sfc low--which the sfc cold front (well upstream of the NYC tornadic storm) stemmed from--dropped all the way down to 985 mb by Saturday evening (8-9 PM local time)... 3.5+ standard deviations below climo for early Sept.  This fact certainly didn't result in a large (low level) hodograph for this event mid-morning Saturday well south and east in NYC metro... but it's worth noting the parent low-level cyclone was somewhat of a whopper.


Sunday, September 2, 2012

EHI vs. STP in Davies and Fischer 2009


Comparison of 0-1 km EHI and fixed STP (2003 version; CIN not included) from "Environmental Characteristics Associated with Nighttime Tornadoes" (Davies and Fischer 2009).  This paper utilized a database of 1705 RUC proximity soundings associated with supercells east of the Rockies from 2001-2006... in order to study discrimination of thermodynamic and vertical shear parameters among the subsets of daytime non-tornadic, daytime weak tornadic, daytime sig tornadic, nighttime nontornadic, nighttime weak tornadic, and nighttime sig tornadic supercells.  For brevity's sake, STP (among other discussions) had to be excluded from the paper.  The STP graphic (in two "pieces" above) was hand-drawn by Jon, and while I briefly mentioned its relative discriminatory ability when presenting the paper at the 2009 NWA conference... it hasn't otherwise been seen.  Click to enlarge the images.  Full paper viewable at http://www.nwas.org/ej/2009-EJ3/.

Saturday, July 14, 2012

Saturday, June 9, 2012

Some soundings from 06/09/12 sfc-based convective failure in bulk of Dakotas


Above image: 23Z initialized RAP sndg at ABR overlaid on 00Z ABR RAOB.  Click to see full image.


Above image: 12Z NAM-WRF sndg overlaid on 09Z NAM-KF sndg; both at ABR, valid times of both = 23Z.  Click to see full image.

Wednesday, March 10, 2010

03/10/10 quick forecast

12Z RAOBs show skin-layer moisture at SHV/LIT...with >1km deep moisture now SE of a ~IAH-GLH-BNA line. Not sure BL trajectories will strongly favor pulling deeper moisture up to ne OK/se KS by sundown... so the 12z NAM output showing sfc "dewpoint holes" and high-ish LCLs may be reasonable. Also still dislike this type of pattern (intense UVVs/backing deep shear with time ahead of a compact vort)... as well as the terrain, though it's obviously even worse toward the Ozarks. Not sure hugging the quasi-stationary front in the better terrain in KS is viable given moderate NNE storm motions are expected (and low LCL/LFC may be no more favored there than just SE). It's possible parts of AR would be more favorable for tors (after dark) given stronger moisture/higher likelihood of discrete storms.

Thursday, January 28, 2010

January 21, 2010 review: minisupercell with EF-2 tornado in Huntsville AL

January 21 brought an interesting severe weather scenario to the Tennessee Valley region, with a number of low-topped severe storms--including at least two tornadic mini-supercells. The tail-end charlie storm in particular (see 22Z visible satellite/radar overlay below) produced an EF-2 tornado in the city of Huntsville around 2325Z. Several videos on youtube show a remarkable structure to the storm, with relatively high-contrast features and pretty coloring with sundown.


A stacked low pressure system (see 00Z 500mb RAOB plot and 22Z subjective surface analysis below) moved ENE through the region and, in conjunction with diurnal heating beneath a large scale dry slot, was responsible for the severe storms. The regime had similarities to a "warm sector variety" Davies cold core set-up, although the tornadic storms occurred south of the path of the mid-level low--not necessarily tied directly to PVA ahead of the closed low. As with typical cold core setups, the cold temperatures accompanying the mid-level system contributed to ideal low-level thermodynamics for tornadoes.


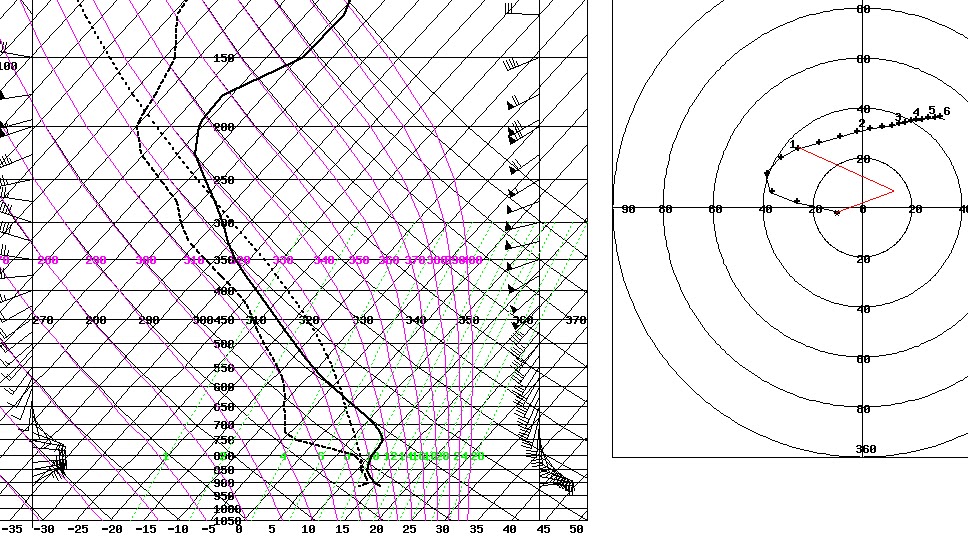
Fortuitously, the 00Z RAOBs at BNA and BMX were launched just ahead of the occluded/cold front. With Hunstville sitting exactly between each, a representative sounding was easily created by compositing these two soundings (i.e. an average of the two) and then appropriately modifying the near-surface layer (63/53°F inflow environment). This composite sounding appears below (substituted on the BNA sounding). With -2°C 700mb temperatures overspreading ML dewpoints in the mid-50s°F, 0-3km MLCAPE is very large (175 J/kg); and total MLCAPE is respectable (1051 J/kg). MLLCL heights are also quite low (708 m agl). Again, as per Davies research, strong low-level stretching likely played a substantial role in allowing for the Huntsville tornado. Actually, given that the BMX RAOB used to make the composite actually showed a warm-ish mid-level subsidence inversion "hanging on" beneath or immediately south of the mid-level jet axis (which was no doubt not present to any extent at Huntsville's latitude), it's possible the low-level and total CAPE were even slightly more favorable than I've shown in this sounding.


The shear profiles observed on the BNA and BMX RAOBs were largely straight-line, with only ~60 m2/s2 of 0-1 km SRH using the observed motion of the Huntsville cell. It's possible these observations were a bit too close to the occluded front, which would explain the veering immediately above the surface. The local 88D at Hytop AL (HTX), however, sampled a somewhat more favorable low-level shear environment immediately downstream of the tornadic storm in the warm sector. The VWP data was quite consistent during the course of the event, and looked reasonable when eyeballing the size/orientation of the BNA/BMX hodographs against the FFC hodograph (N of the "wedge front"). The mean HTX VWP hodograph from 2303-2322Z is shown below. This hodograph was characterized by 0-1 km SRH of 155 m2/s2... which is more than sufficient for tornadic development when coupled with the ideal low-level thermodynamics. Deep layer shear and mid- through high-level storm-relative flow were also favorably strong... although with the low ELs/storm tops in this case, it is tough to know what sort of storm depths/heights are appropriate for gauging a parameter such as deep-layer shear.


Saturday, October 31, 2009

May 8, 2009 review: devastating derecho from S Plains to OH/TN valleys

A few weeks ago I put together a simplistic meteorological summary page on the 05/08/09 derecho event, with quite a bit of observational data. This page can be viewed HERE.

Here's two teaser images from the page: a 12Z subjective surface analysis, and the 00Z-12Z RAOB evolution at Springfield, MO.


Wednesday, May 20, 2009

May 13 review: Killer tornadoes strike northern MO

A powerful supercell produced a few damaging tornadoes across portions of far northcentral/northeastern MO on May 13. The first of these, rated EF-1, killed a woman in a mobile home near the town of Milan MO. The second, also rated EF-1, passed near the town of Novinger MO but caused no injuries/fatalities. The third tornado produced EF-1 damage in northern sections of Kirksville MO, also killing two more people to the northwest of town. This tornado strengthened to an EF-2 as it moved toward the town of Clay MO. The storm went on to produce two more weak tornadoes north of Edina MO.


A pair of elevated TS clusters were ongoing over portions of the Midwest on Wednesday morning, to the north of the surface warm front. The lead cluster over much of IL was driven by sharp moisture advection/convergence in the exit region of a 60-70 kt westsouthwesterly LLJ, while the trailing, more intense cluster was crossing the northern third of MO in advance of a potent low-amplitude 7H shortwave trough. An MCV, remnants of severe convective storms across the southern High Plains the prior evening, was also crossing the Ozark mountains at this time… and began to ignite surface-based storms after 15Z across far southern MO.


In the wake of these convective systems, a pronounced EML was overspreading the central Plains amidst weak shortwave ridging…well downstream and equatorward of the primary, strong shortwave rotating into the northern Plains. In fact, the central Plains capping thermal ridge underwent amplification during the late morning and early afternoon, as evidenced by 7H temps increasing from 11°C to 13°C at TOP between 12Z and 18Z (see RAOB overlay below, with extreme mid-level lapse rates by 18Z). Also note, despite the presence of the stout cap aloft, diurnal mixing still took a pronounced toll on prefrontal boundary layer moisture...with the richest moist layer becoming decidedly shallow by 18Z. Observed 100 mb ML dewpoints on the 18Z TOP and OUN RAOBs only ranged from 60-64°F… not a particularly positive sign. Still, it appears that persistent south-southwesterly low-level flow ahead of the cold front, coupled with evapotraspirative effects, helped boundary layer moisture quality to recover again through the afternoon (ML dewpoints increasing back to the 64-68°F range) per 00Z RAOB data.


Short-term guidance and conceptual models suggested SRH would be marginal for a significant tornado threat over the majority of the area east of the cold front, given 1) veering of near-surface winds to SSW amidst deep vertical mixing, and 2) the primary LLJ axis shifting away from the area. The obvious exception to this would be in the raincooled, gradually recovering BL airmass across northcentral and northeastern MO… where guidance suggested 0-1 km SRH AOA 250 m2/s2 would be possible given not only weaker BL mixing (more backed near-surface component) but also the maintenance of a somewhat stronger LLJ (~40 kt) nearer the primary low-level cyclone riding the U.S.-Canada border. By mid-afternoon (see crude 21Z sfc analysis below), surface observations showed the warm front rapidly redeveloping northward toward the I-80 corridor in IA/northern IL; while to its south, modifying outflow air was evident via a dense VFR stratocu deck and south-southeast sfc winds amidst low 70s°F over upper 60s°F. Given sfc winds just to the north (e.g. far southeastern IA) were slighly more veered, it is possible that an outflow boundary remained anchored along and just south of the Kirksville-Quincy-Winchester corridor. Regardless, observational trends clearly supported better-than-progged SRH/LCLs for a sig tor threat over this modifying airmass. The primary question was the strength of the low-level destabilization, given that BL heating would remain modest and a formidable 7H thermal ridge was still cresting not far west of the area via the 18Z TOP RAOB.


Shortly after 21Z, a combination of frontal lift/convergence, weak height falls aloft, and rapid cooling of the capping layer from the west all resulted in explosive convective initiation along the cold front from the KS Flint Hills up toward Des Moines IA (see visible satellite pic below). More importantly, a prefrontal confluence band—coincident with a narrow low-level thermal ridge with sfc temperatures warming into the low 80s°F—initiated a broken line of storms just east of the I-35 corridor, from Kansas City to Princeton MO. The fact that this latter band of storms was able to initiate ahead of the primary surface boundary was probable confirmation of what afternoon RUC model soundings had suggested: that the very warm capping thermal ridge had held primarily west and south of the MO river; while a very deep/moist boundary layer, with essentially no capping inversion aloft, had evolved amidst the recovering airmass over far northcentral and northeastern MO.


Given westnorthwest-oriented deep layer shear vectors atop the cold front and prefrontal trough, discrete cellular mode actually dominated for the first few hours after initiation. Additionally, stronger flow fields aided the northern storms in moving eastward off the boundaries, while markedly rightward-deviant motions amidst very strong CAPE helped southern storms move off the cold front across portions of KS and eventually northern OK. With a consolidating/strengthening supercell emerging across far northcentral MO and crossing the effective outflow boundary near Milan MO… the stage was set for a cyclic tornadic supercell.


A representative thermodynamic environment for this tornadic supercell was attained by modifying the 00Z DVN RAOB alongside the 00Z TOP RAOB (Kirksville sits about halfway between each). The surface warm front lifted through DVN (~120 miles NE of Kirksville) just prior to the 00Z RAOB launch, which means its sounding--characterized by 2100 J/kg MLCAPE and no MLCINH, despite a saturated boundary layer--was strongly representative of the modifying outflow pool. Meanwhile, just behind the low-level cold front, not only was TOP’s capping inversion aloft (having cooled very markedly the past few hours) similar in magnitude to DVN’s… but the entire thermal profile above the frontal inversion was nearly identical to DVN’s as well. It’s possible that mid-level thermal ridging near Kirksville wasn’t quite as suppressed as at TOP (and yet hadn’t advanced as far NE as DVN)… but this is assumed to be negligible. Below is the modified DVN sounding to represent the Kirksville event. Note moderate-bordering-on-strong instability (MLCAPE = 2455 J/kg); a very deep/moist boundary layer, with remnant EML above 650mb; and strong boundary layer RH (MLLCL < 800 m). Although MLCINH is weak to nil... note that low-level instability is not particularly strong (0-3 km MLCAPE = 41 J/kg), given the nearly saturated, weak-lapse-rate environment below 3 km.


Creating a single, strongly representative sr-hodograph for this event is more difficult given the gradual veering of low-level winds observed in the modified outflow air between 21-00Z. Regardless, the DVN RAOB and Winchester IL profiler were ideally situated to sample the vertical shear within this airmass, and both indicated a very strongly sheared low-level environment for the duration of this event--with very large 0-1 km SRH. Hodographs #1 and #2 below are those observed on the Winchester profiler (N of the effective outflow boundary and ~100 miles ESE of Kirksville) at 21Z and 00Z. Note that veering 0-1 km flow by 00Z is offset by acceleration of the synoptic LLJ to near 50 kt... actually resulting in an increase in SRH, given low-level winds were still strongly backed in a storm-relative sense. The third hodograph, from the raw 00Z DVN RAOB (120 miles NE of Kirksville)--likely launched around 23Z--is a good "medium" between the two... and also produced the largest low-level shear of the three, with 0-1 km SRH at a whopping 460 m2/s2. [Short-term model guidance vastly underestimated the size and pronounced "sickle shape" of these hodographs within the modifying outflow air... with NAM and NAM-KF models forecasting more veered near-sfc winds and a weaker LLJ.] Deep layer shear also appeared favorably strong via these hodographs, with around 50 kt of 0-6 km bulk shear. One final thing to note is that mid- and upper-level storm-relative winds on the three hodographs are pretty modest (20-35 kts)... and when coupled with anomalously rich PWATs (> 1.5"), this probably contributed to HP supercell processes that acted to temper the strength of these tornadoes. [Given that a very rare combination of ~2500 MLCAPE and ~400 0-1 km SRH existed amidst ideal low-level thermodynamics (albeit modest 0-3 km CAPE)... it would seem that the tornadoes from this storm could have been far more violent than they were.]


Finally, below are representative profiler hodographs for the tornadic supercells affecting the Burlington KS and Lamont OK areas, respectively. The latter tornado was a surprisingly long-lived and nearly stationary cone. The thermodynamic environment in these areas was characterized by higher LCL/LFC, but very strong instability (MLCAPE 3500-4000 J/kg) and steep low-level lapse rates/no CINH. This may have facilitated strong near-ground stretching to help in the production of tornadoes. Also, low-level hodographs remained a bit more kinked than forecast... and given the strongly deviant storm motions (almost too strongly deviant in the Lamont case, given the increasingly parallel nature of the storm motion with the near-sfc shear vector)... 0-1 km SRH was actually pretty favorable, in the 140-170 m2/s2 range. Note that deep layer shear is solidly on the low end for supercell storms though (~30 kts of 0-6 km bulk shear)... with the large instability likely playing a role in allowing for sustained supercells.


Thursday, April 30, 2009

April 29 review: mesoscale magic in the TX South Plains

A potent supercell tracked between the Plainview and Matador TX areas yesterday, producing a couple substantial/photogenic tornadoes northeast of the town of Floydada. Surprisingly, not terribly many local chasers were on it... perhaps due to its relatively short tornadic period before going OFD... or due to other sucker storms existing farther E. SPC handled the forecast well IMO. Model signals were pretty subtle for a significant event... though knowing that OFBs might come into play later, coupled with the amount of BL moisture lurking to the southeast, was a sign that some mesoscale magic could definitely occur.

During the morning hours, an elongated shortwave trough tracked eastward thru KS-OK, supporting scattered thunderstorm activity. The airmass feeding into these storms was characterized by anomalously strong precipitable water values and effective parcels already rooted near the surface. A strong MCS was thus gradually born over the Red River valley, on the southern flank of the convective activity. The far western segment of the MCS outflow appeared to settle southwestward, and by early afternoon curved E-NE-N along a Crowell-Turkey-Wayside-Amarillo TX line (see 1945Z visible satellite image below). A second surface boundary was also evident on satellite, extending E-W from Crowell-Matador-Plainview and intersecting the dryline near Springlake. The latter E-W boundary was not apparent via the TX mesonet, but gradually appeared as a fineline of reflectivity on Lubbock's radar... its signature probably becoming blended with an increasingly well-defined RFD gustfront off the supercell-to-be. Also of note, a convergence line/surface trough was present in the moist sector a few counties east of the dryline, generally straddling the I-27 corridor.


A trailing shortwave trough, low-amplitude but well-defined in nature, approached west TX by mid-afternoon. Persistent isallobaric forcing, likely a result of both an upswing in QG ascent and increased heating of the outflow air, produced a well-defined low-level mass response along and east of the dryline between 21Z and 23Z. (
See sfc obs below... no frontal analysis done as my usual analysis software doesn't have the TX mesonet data.) Enhanced downward mixing of westerly momentum forced the dryline eastward, where it merged with the convergence line near I-27; meanwhile, surface winds in the moist sector increased and backed substantially to the ESE. The supercell in question developed near the intersection of the E-W boundary and the effective dryline by 21Z, and tracked E to ESE along or just north of that boundary.


The Jayton profiler, located about 50 miles SE of where the storm became tornadic near Floydada, captured the mass response quite dramatically. Note in the 22Z and 00Z Jayton profiler hodographs below, the 500-1000 m flow backing and increasing to near 30 kt. Accordingly, given such a strong sr-inflow component and a perfectly kinked and curving hodo below 1 km... strong to very strong 0-1 km SRH resulted. Using the Plainview storm motion, 0-1 km SRH on the 00Z Jayton profiler was > 330 m2/s2 (with continued strong curvature through 3 km contributing to > 550 m2/s2 of 0-3 km SRH).
Also note, 0-6 km bulk shear was moderate to strong, in excess of 50 kt. In comparison, the 00Z Amarillo RAOB hodograph (third hodograph below) showed 0-1 km SRH of ~200 m2/s2... though it's possible the strongest low-level mass response hadn't yet occurred by the time of balloon launch (~23Z) and/or occurred farther south only. With neither OFB evident in surface data and likely becoming increasingly diffuse given increased mixing/heating and mass response... it is tough to know whether or not the boundary enhanced horizontal vorticity available to the storm. Regardless, I would think the shear sampled by the 00Z Jayton profiler is a reasonable estimate for the Floydada area tornadoes, with any changes in the shear due to increased elevation on the caprock escarpment probably marginal.


The thermodynamic environment available to this storm was likewise very impressive, due to the influx of upper 60s surface dewpoints up onto the caprock combined with fairly modest capping aloft. In order to achieve the correct elevation/pressure surface for Floydada (which is a good 500 feet lower than AMA), I used a base NAM-WRF model sounding with a 900mb pressure surface (ideal given relative pressure surfaces in the region that evening) and applied the AMA RAOB data to it, blending the BL using TX mesonet data. The resulting dewpoint lapse rate is dry adiabatic (similar to that observed at AMA)... but this is known to happen when anomalously rich near-surface moisture exists. Bottom line, note the strong instability (MLCAPE > 3100 J/kg), very strong 0-3 km MLCAPE (~150 J/kg), and sufficiently low MLLCLs (1200 m). The second sounding below is the raw 00Z AMA RAOB, which likely got "munched" by anvil-level convection just above 200 mb.


In reviewing this data, it is probably a good thing for TX residents that the storm quickly became outflow dominant (with the gust front apparently undercutting the updraft and encouraging evolution to a small bow)... because the mesoscale environment was truly primed for strong to violent tornadoes. If I had been free to chase on this day, I hope that I woulda taken the chance on it.